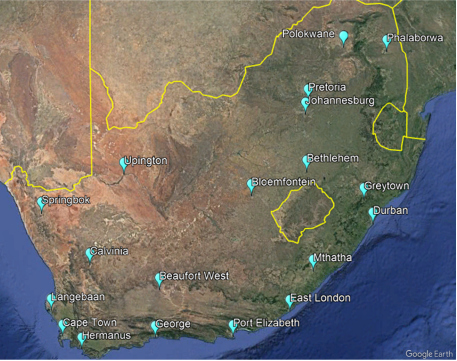
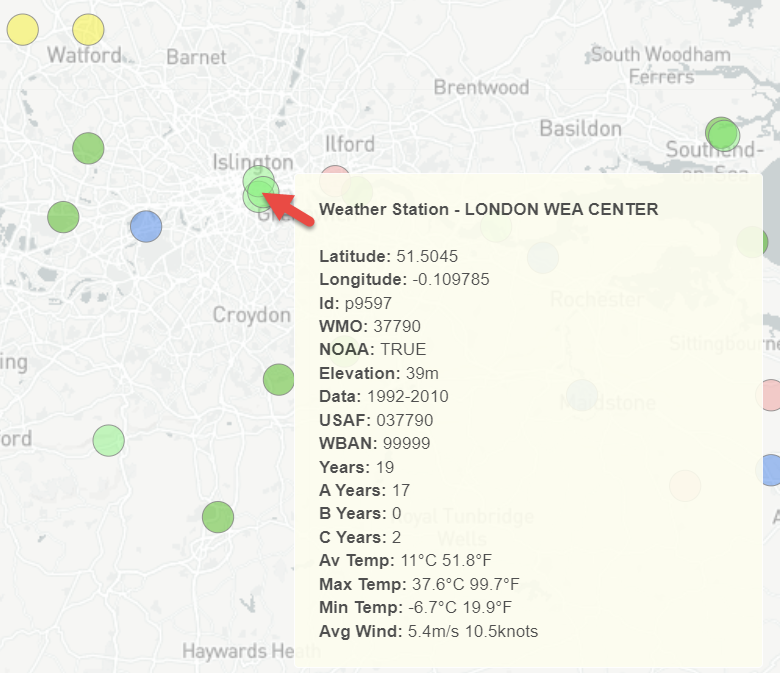
Site weather data is an essential input for building energy, comfort and daylighting simulations, providing the key environmental conditions needed to drive the calculations. DesignBuilder Climate Analytics has been developed specifically to meet the needs of building energy modellers. It provides a vast database of high-quality hourly weather data along with analysis tools to help select the most appropriate data. With access to best-practice weather data selection tools, you can have complete confidence in the climatic inputs to your building performance simulations.
Key features
- A comprehensive set of global weather data and analysis tools for building performance simulation
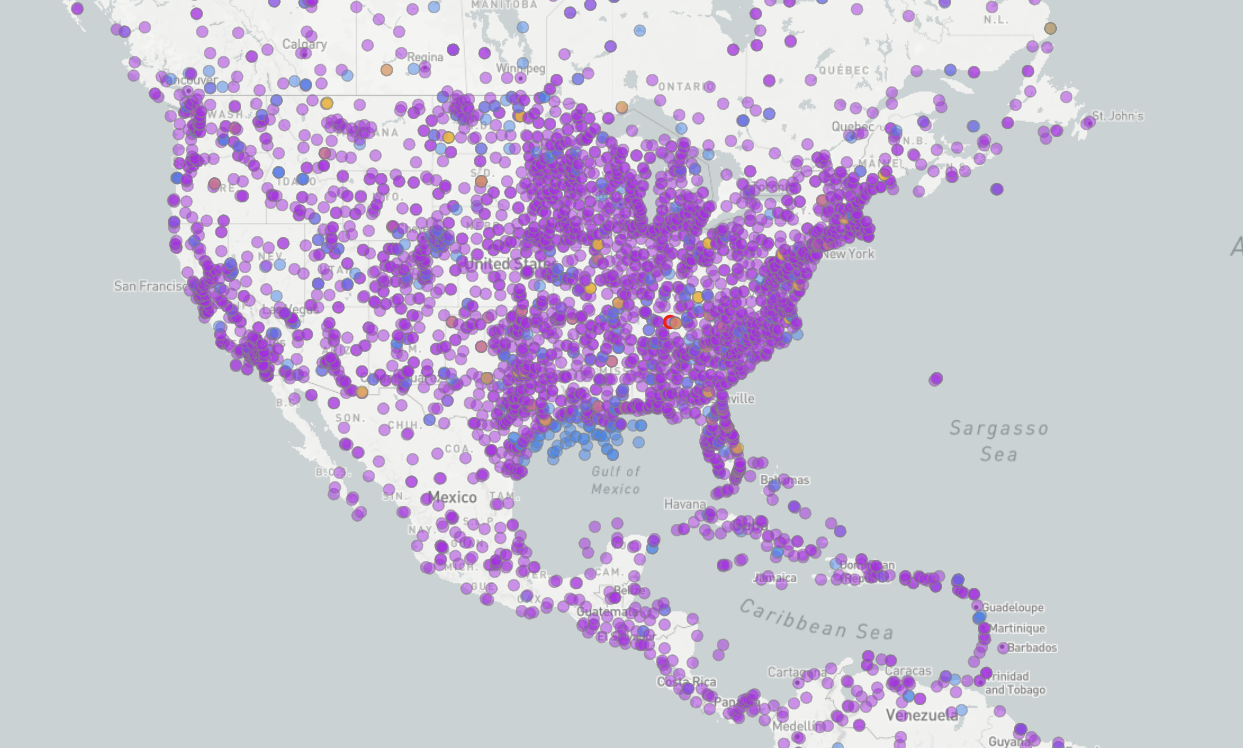
- Access hourly weather data for any site worldwide through an easy-to-use web page
- Accurately measured data from over 43,000 weather stations and gridded satellite data measurements from 1970 to present day
- Graphical selection tools assist with analysing the Climate and choosing appropriate design data for your projects based on a wide range of criteria
- Customise design weather data to your exact requirements with options to override measured data with design values and/or offsets for temperature, sky type, wind etc.
- Data downloaded in the widely used EnergyPlus EPW file format
- Include the impact of future climate scenarios
- Consider urban heat island effects
- Monthly updates ensure you always have access to the latest Actual Year data
- Access the weather data libraries from Climate.OneBuilding, White Box Technologies and EnergyPlus through the Climate Analytics graphical interface
Applications
- Compliance and Certification
- Building Design Simulations
- Post Occupancy and Design Studies
- “Digital twin” calibrated models
- Overheating analyses for naturally ventilated buildings
- Heating and cooling design applications
- Post-occupancy measurement and verification studies
- Design stage energy use and environmental performance projection
- Stress testing under extreme events
- Future climate testing
- Annual daylight analysis
- Standard testing
Types of Weather Data
The available weather data types can be divided into Design years, Actual years and Typical years.
Design Year
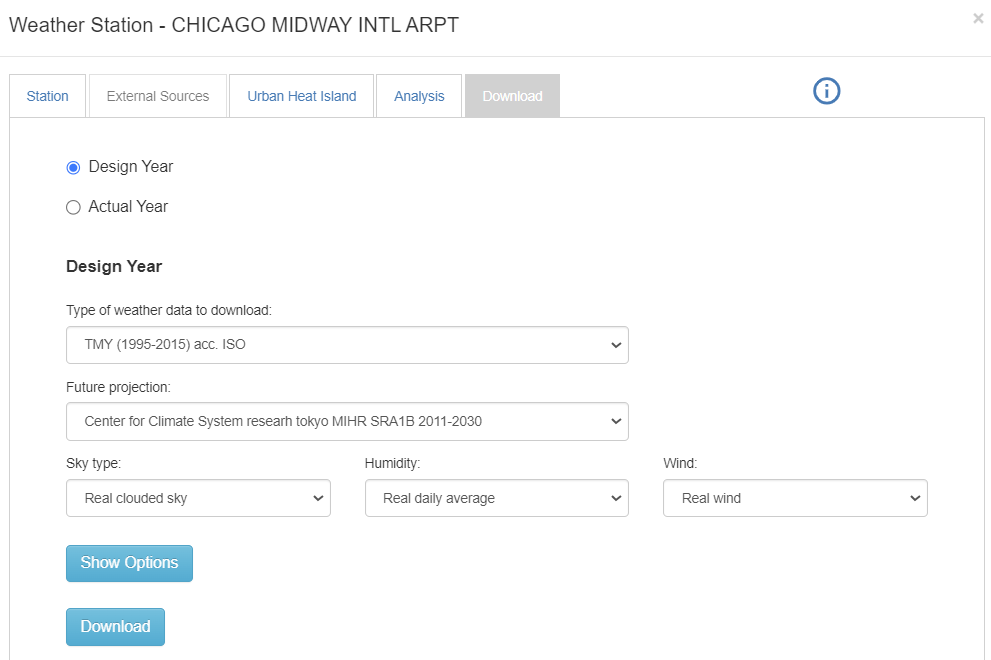
- Design Year weather data is specially selected for a specific application, such as overheating assessments or sizing applications. They are not normally used for general-purpose building energy simulations.
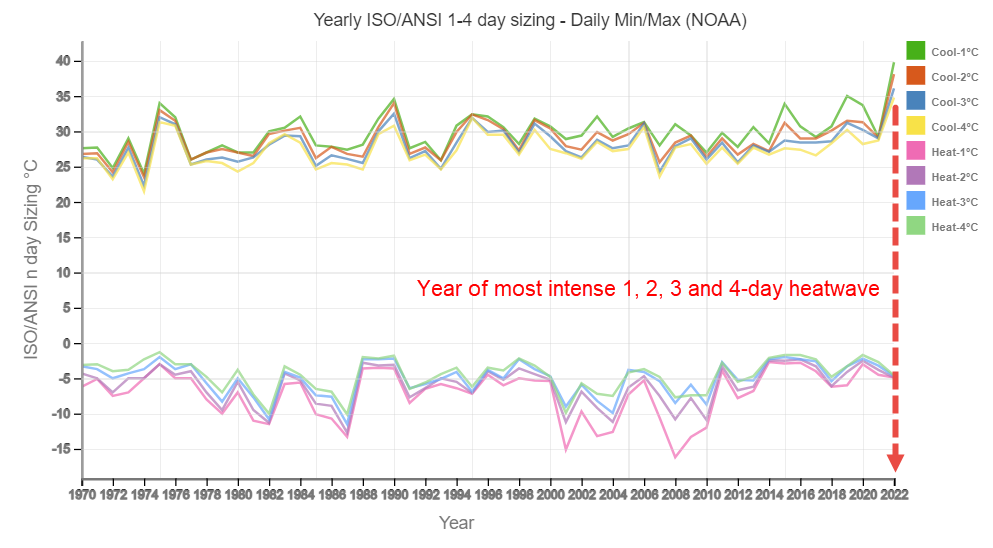
- It usually contains a specific year of weather data with an extreme characteristic, such as the year with the most intense heat wave based on the warmest run of 4 days.
- Typical applications are for overheating analyses for naturally ventilated buildings and heating and cooling design simulations.
- Includes options for data modification and morphing for future climate or extreme weather scenarios (see below).
Actual Year
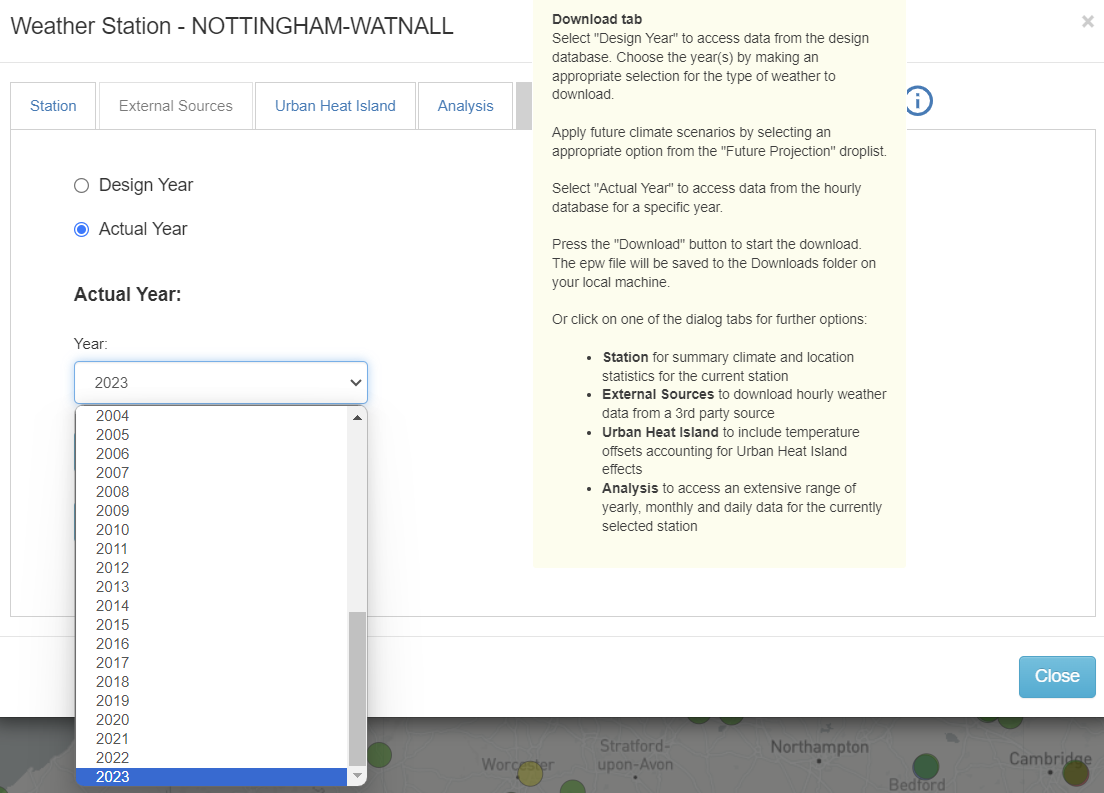
- A specific year of weather data, often used for post-occupancy Measurement and Verification studies where the simulation results are compared to actual utility bills or other measured data.
- Ideal for use with digital twin, calibrated models and design work requiring the highest quality weather data.
- Actual years can also be used as part of a more thorough approach to design or energy analysis.
- Based on finely-gridded hourly data from 1980 until present day.
- Monthly updates ensure you always have access to the latest data.
Typical year
- Typical years are commonly used for general purpose energy and environmental simulations and for compliance and certification work.
- They are representative of long-term weather compiled from 20-30 years of data and match the long-term data from a particular location.
- Typical weather files use “real” data but may not be a contiguous year.
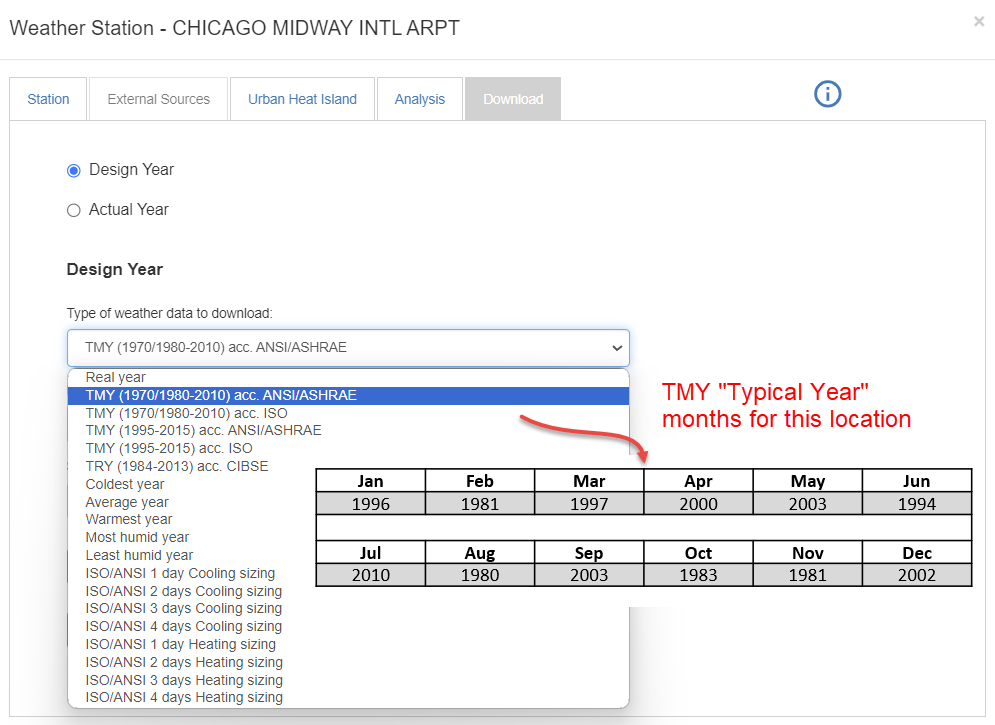
- Data is made up of months from multiple years across two or more decades.
- Examples of Typical year formats available through Climate Analytics (internal and external sources) are IWEC, TMY, TMYx, TMY3, TRY and CWEC.
Climate Analysis Features
Analysis of Design Year Data
- Data visualisation and selection tools help to identify design years and design days.
- Checking data quality for the selected location to see how much measured data is available.
- Understand the climate based on extensive historical data.
Custom Locations
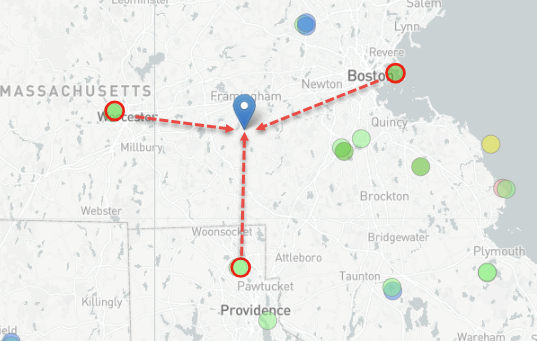
- All types of Climate Analytics weather data (Typical, Design and Actual Years) can be generated for any site location.
- For locations with no specific nearby station, data for a new virtual station can be generated by interpolation from selected stations.
Design Year Modification and Morphing
- Measured Design Year data can be modified to help model the impact of various types of extreme weather scenario, such as clear or dark skies and high or no wind. This is done by adjusting measured data based on selected design settings for sky type or wind.
- Design Year data can also be morphed to include:
- The impact of future climate scenarios can be included based on a wide range of IPCC climate projection models.
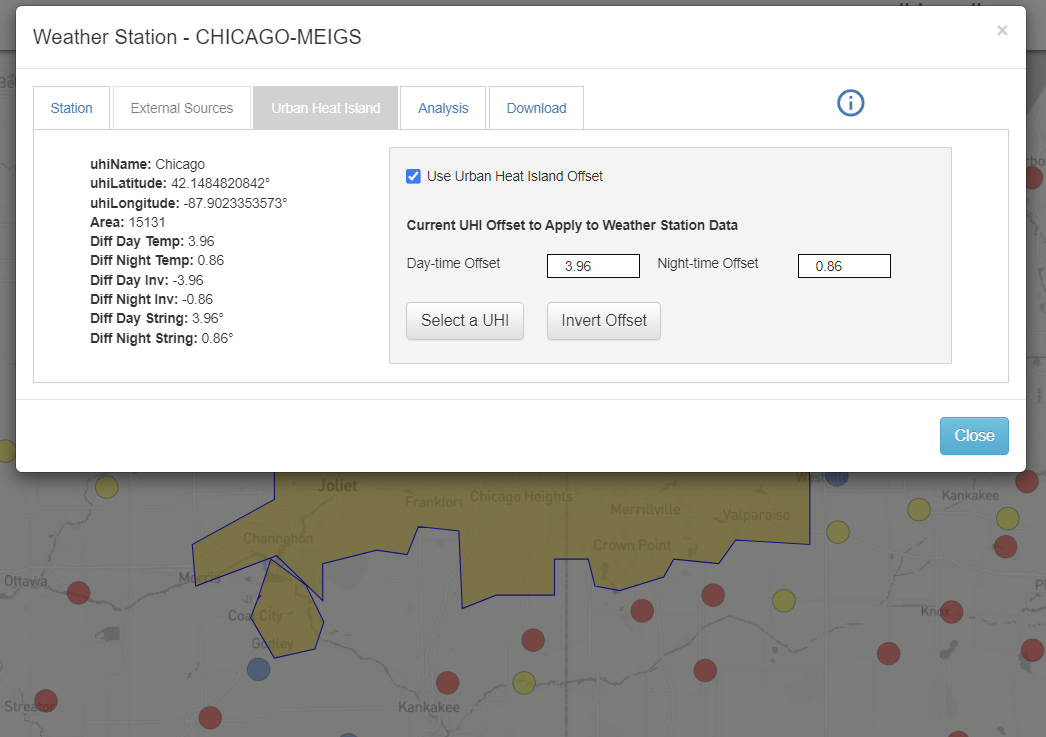
- Urban heat island effects using day and night-time offsets from the NASA database.
Data from External Sources
To access most of the Climate Analytics features described on this page a paid licence is required, however it is also possible to access limited functionality with a free licence through our map interface. This provides access to:
- The Climate.OneBuilding library of typical year TMYx weather data for 17,476 locations in more than 195 countries. This library is provided at no cost by Dru Crawley and Linda Lawrie, creators of the EPW file format.
- The library of 2,458 typical year weather files provided at no cost by EnergyPlus.
The White Box Technologies library of Typical year and Actual year weather data developed by Joe Huang with 13,946 stations can also be accessed with a free licence, however the data itself is chargeable, and is not included with Climate Analytics licences.
Screenshots
Case Studies
Data Sources and Quality
The main DesignBuilder Climate Analytics dataset is based on the Integrated Surface Database (ISD) which consists of global synoptic daily observations compiled from numerous sources into a single common format and data model. The data held in the ISD is checked by an extensive set of quality control algorithms for data validity, extreme values, internal consistency, and consistency with other observations for the same station.
Design Year data is based on measured daily min/max temperature, humidity, and wind speed data from stations combined with gridded data. Behind the scenes, the daily max/min values are used to generate the hourly variations in solar radiation, temperature, wind etc for each day required for the hourly weather files.
Actual Year data is obtained directly from a dense grid of values from NASA's MERRA2 reanalysis data. The spacial grid size is 0.5° latitude x 0.625° longitude with 72 pressure levels. Actual year data is of significantly higher temporal resolution than design data.
For more details see our informative Climate Analytics Data Sources and Quality help page.
Climate Analytics Webinar
You can find out more about Climate Analytics in our webinar here.


