Case Studies > General Simulation
Measuring Façade Thermal Resilience: A Simulation-Based Framework Enabled by DesignBuilder
| About | DesignBuilder used to evaluate how façade strategies can strengthen thermal resilience under future climate scenarios. | 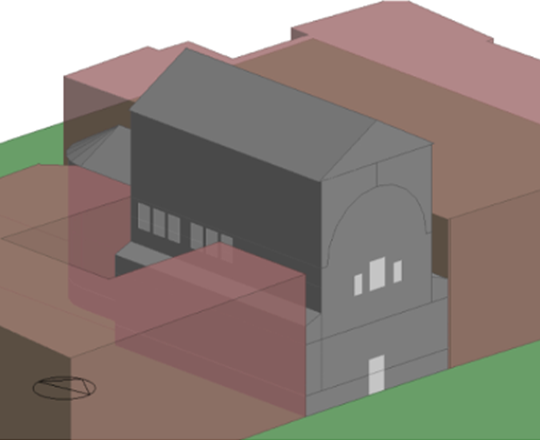 |
| By | Zahra Jahed Bozorgan, Architect & Building Science Researcher, University of Bologna. | |
| Location | Europe | |
| Category | Façade thermal resilience, Simulation-based research. | |
| Highlights |
|
Introduction
Summer overheating is increasingly affecting European buildings, not primarily because of inefficient systems, but because a large share of the existing building stock was never designed for summer conditions. This is particularly true for residential buildings constructed before or during the major insulation waves, where façades were optimised for winter heat retention rather than for managing prolonged heat stress. Across Europe, millions of these façades remain un-retrofitted, and in warm and temperate climates, they have become a dominant driver of indoor overheating during heatwaves.
In this context, thermal resilience cannot be treated as a whole-building or system-level property alone. During extreme heat events, especially under Cooling-OFF or power-constrained conditions, the façade governs how quickly heat enters the indoor environment, how much of it is stored, and how slowly it is released. Insulation level, thermal mass, glazing ratio, and construction period directly shape the dynamic thermal response of buildings. For this reason, this work deliberately shifted the analytical focus from systems and annual energy metrics to the façade as the primary control surface for summer resilience.
To meaningfully assess façade-driven resilience, a metric was required that could move beyond isolated overheating indicators and capture how façades behave over time under stress. The Façade Resilience Index (FRI) was therefore developed as part of a structured framework that quantifies three distinct but interrelated “phases” of thermal response: resistance (delay and accumulation of overheating), robustness (behaviour during peak stress), and recovery (return to acceptable conditions after the event). This formulation transforms resilience from a qualitative label into a measurable quantity derived from dynamic thermal behaviour.
The framework was not designed to work for a single climate or construction type. Instead, it was intentionally stress-tested across three European climates (Italy, Germany, and Norway) and three representative façade typologies per climate, reflecting different construction periods and retrofit levels commonly found in the European housing stock. This design choice was essential to verify that the FRI does not merely describe one specific case, but remains stable, interpretable, and comparable when façade properties and climatic stress are systematically varied.
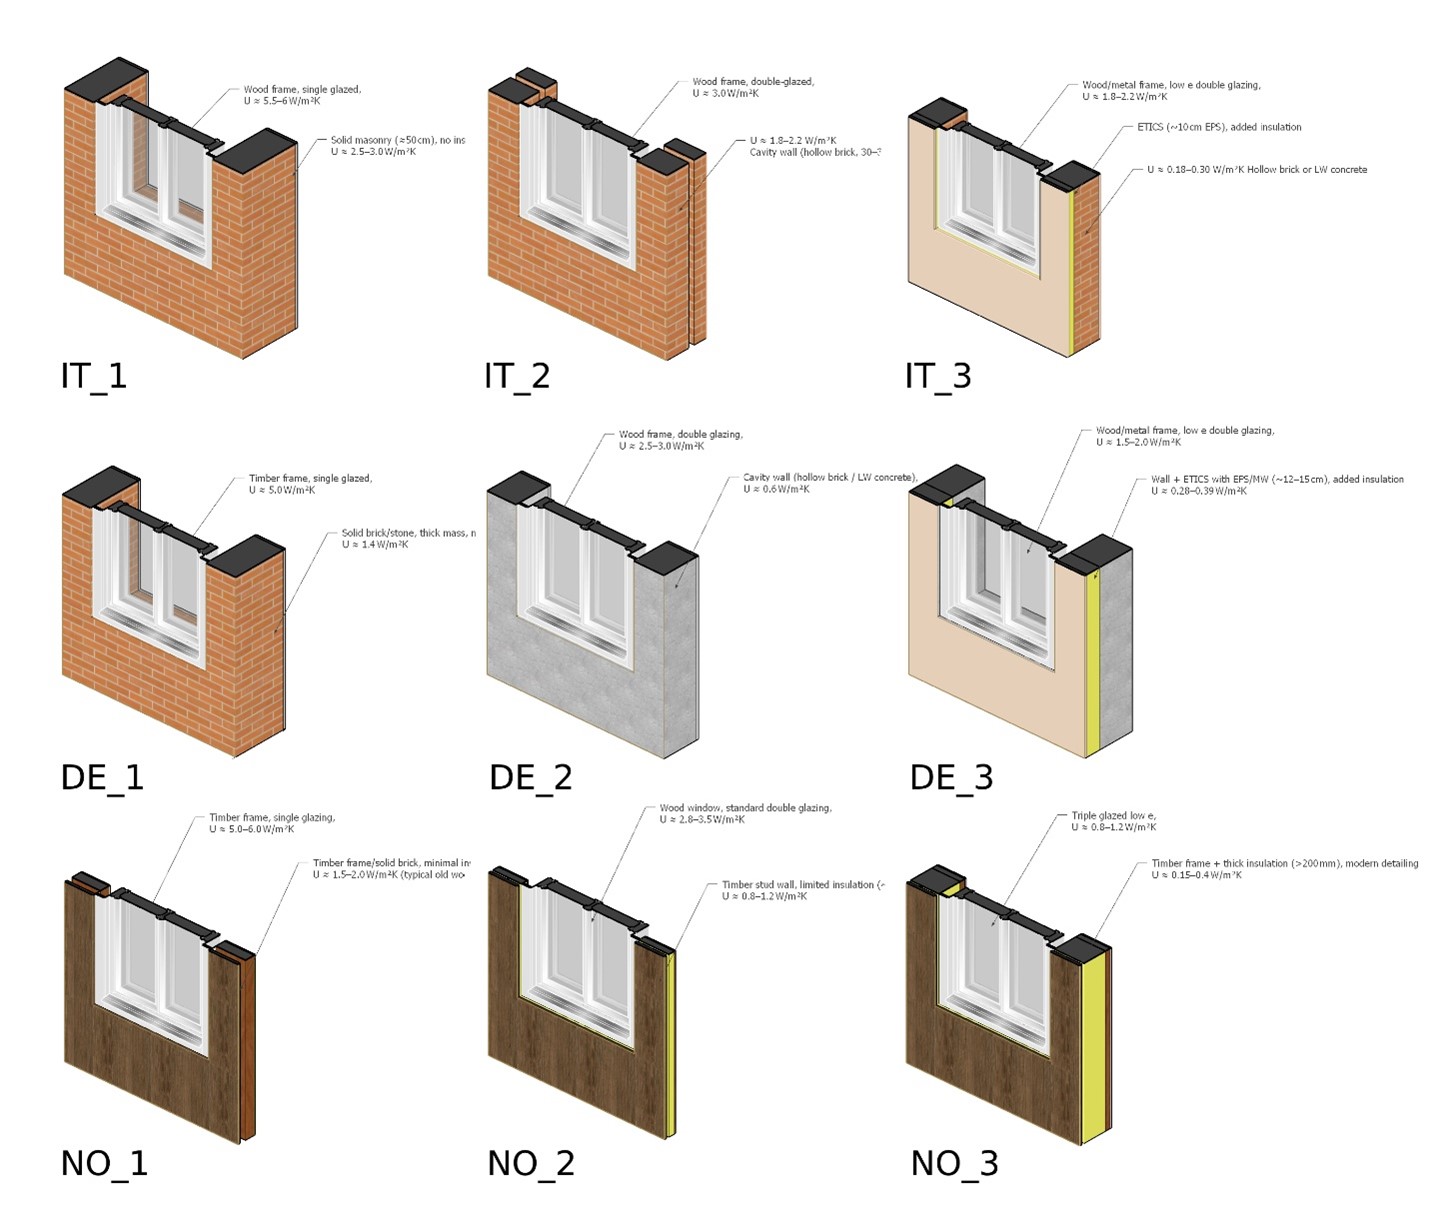
Figure 1. Isometric representation of the nine representative residential façade typologies considered in this study,
covering three construction periods (pre-, mid-, and post-retrofit) across Italy, Germany, and Norway. Source: own
The DesignBuilder-based simulation framework enabled a systematic quantification of façade thermal resilience across climates, time horizons, and operational regimes. Five key quantitative findings emerged from the analysis.
Quantifying Thermal Resilience
To address thermal resilience, 3 stages of resilience were conceived: Resistance, Robustness, and Recovery - represented by six measurable indicators:
Resistance
- Thermal Autonomy (TA): % hours below 26 °C without cooling
- Indoor Overheating Degree (IOD): ∑(T – 26 °C) in °C·h
- Cooling Load (CL): annual cooling demand (kWh)
Robustness
- Time Above Threshold (TV): % hours above 26 °C
- Maximum Indoor Temperature (Tmax): °C
Recovery
- Recovery Time (Rt): hours required for indoor temperature to fall below 26 °C after the heat event
FRI is calculated as a combination of these six parameters. FRI = 1 represents the best, and FRI = 0 the worst thermal resilience performance, while maintaining comparability between Cooling-ON and Cooling-OFF conditions.
More detail on how FRI and the 6 indicators are calculated is provided in the Appendix at the end of this case study.
Modelling Assumptions
Thermal exchange was permitted only through a single south-facing façade to isolate façade-driven heat transfer and to represent a conservative solar exposure scenario, while all remaining walls were modelled as adiabatic. Each case was represented by an identical reference room (5 m × 5 m × 3 m), ensuring geometric consistency across all simulations. Window dimensions and window-to-wall ratio were fixed (WWR = 30%), with glazing properties (U-value, SHGC, and glazing type) assigned according to construction period. Roofs were modelled with pitched geometries (30° slope) consistent with national residential practices and kept identical across cases. Airtightness was represented by constant infiltration rates of 1.5 ACH (pre-retrofit), 1.0 ACH (mid-century), and 0.5 ACH (post-retrofit). All other geometric and operational parameters were kept constant to ensure that observed differences in thermal behaviour arise solely from façade typology and climatic conditions.
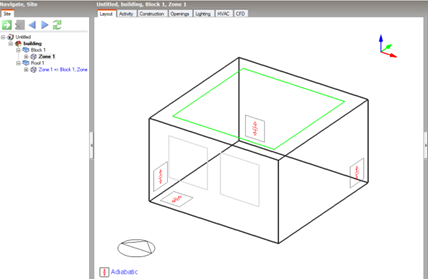
Figure 2. Reference room model used for façade-based simulations. Heat transfer was allowed only through the south-facing façade,
while all other walls were modelled as adiabatic to isolate façade-driven thermal behaviour.
Progressive Collapse of Passive Façade Resilience Under Climate Change
Under free-running conditions (Cooling-OFF), façade resilience declines sharply toward late-century climates, with magnitude strongly dependent on climatic context. Average FRI values for Italian façade typologies decrease from approximately 0.50–0.58 in 2020 to 0.14–0.17 in 2080, corresponding to a 60–75% loss of passive resilience. German façades exhibit delayed but abrupt degradation, dropping from 0.71–0.88 in 2020 to 0.11–0.24 by 2080, indicating a threshold-type failure once night-time cooling becomes ineffective. Norwegian façades retain higher resilience in early periods (0.93–0.96 in 2020), yet even in cold climates FRI values decline to 0.60–0.70 in 2080 for highly insulated typologies. These trends confirm that passive façade resilience is not future-proof under increasing summer heat stress.
Distinct Resilience Mechanisms Under Cooling-OFF and Cooling-ON Operation
Phase-level analysis reveals a fundamental shift in governing resilience mechanisms between operational regimes. Under Cooling-OFF conditions, resilience is dominated by the Resistance phase, accounting for approximately 56% of the total FRI weight, with Indoor Overheating Degree (IOD) alone contributing up to 95% of resistance. This indicates that cumulative overheating exposure, rather than peak temperature alone, governs façade failure in passive operation. In contrast, under Cooling-ON conditions the Recovery phase dominates, contributing approximately 66% of the total FRI weight, reflecting the decisive role of mechanical systems in restoring indoor conditions after heat stress. This divergence highlights that resilience under cooling is system-driven, while resilience without cooling is envelope-limited.
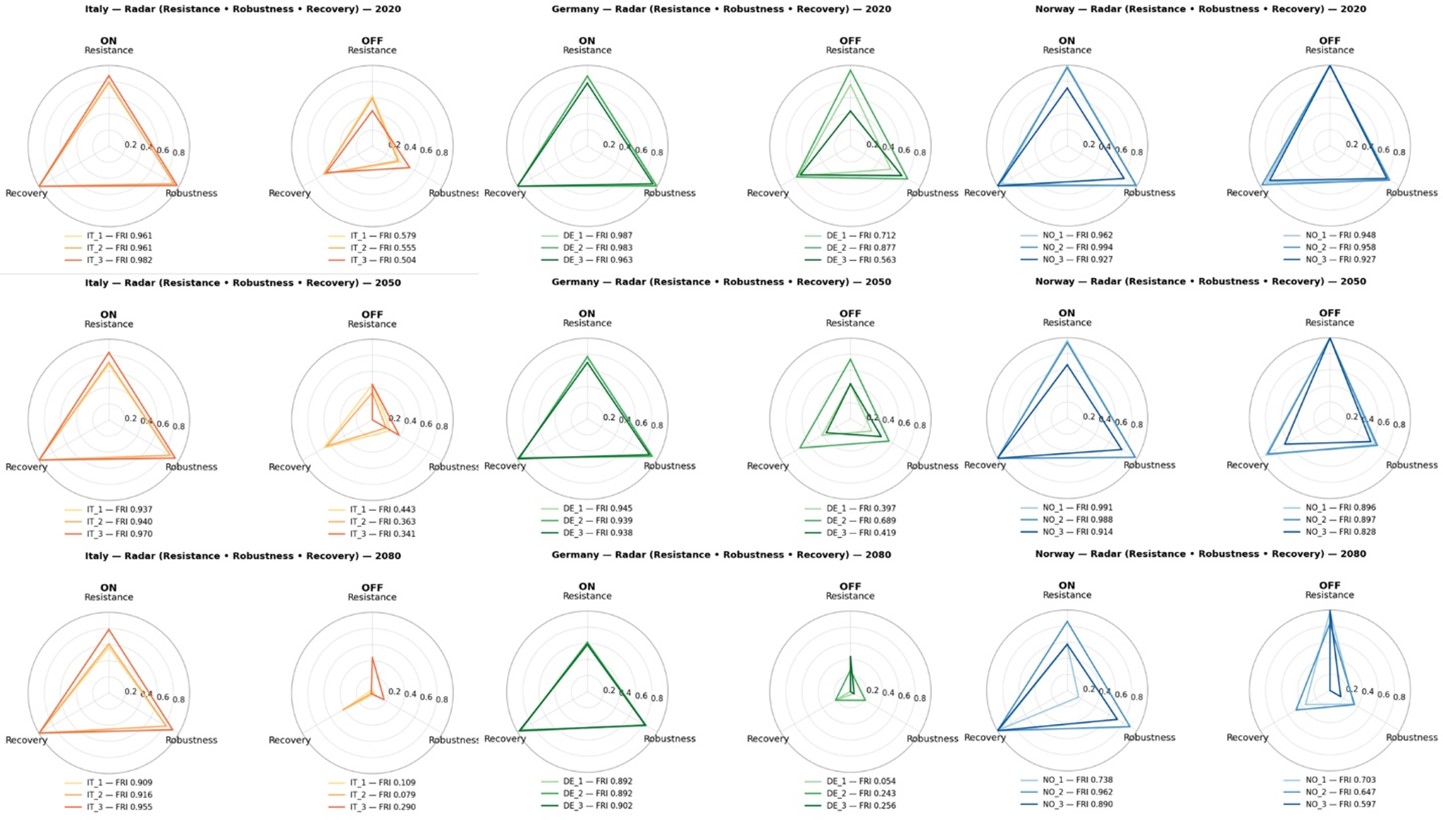
Figure 3. FRI values over time. Source: own
Overheating severity is governed by heat accumulation and exposure duration
Indicator-level results show that late-century overheating severity is characterised by high accumulation and prolonged exposure. By 2080, IOD values exceed 700–900 °C·h in Italian and German cases, compared to 350–500 °C·h in Norwegian cases. Time Above Threshold (TV) reaches 25–32% of summer hours in Italy and 18–26% in Germany, while remaining below 12–18% in Norway. Maximum indoor temperature (Tmax) shows a strong negative correlation with FRI (r ≈ −0.9), but alone does not explain resilience loss; instead, it is the combined effect of duration and accumulation that drives resilience collapse.
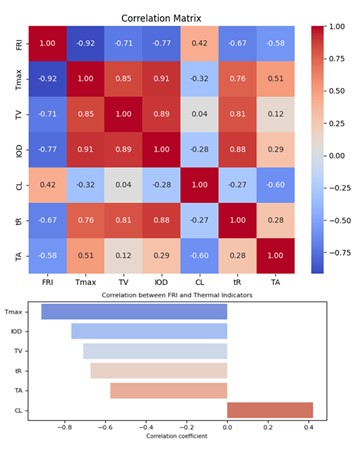
Figure 4. Correlation between Resilience Indicators and FRI. Source: own
Mechanical cooling masks façade-driven resilience differences
Under Cooling-ON operation, FRI values converge across all climates and typologies, remaining consistently above 0.85 even in 2080. The interquartile range of FRI under cooling collapses to less than ±0.05, indicating near-complete suppression of façade-driven differentiation. This convergence demonstrates that high resilience scores under active cooling represent apparent resilience, enabled by mechanical systems, rather than intrinsic façade performance. DesignBuilder’s ability to simulate Cooling-OFF and Cooling-ON within the same modelling framework was essential to exposing this masking effect.
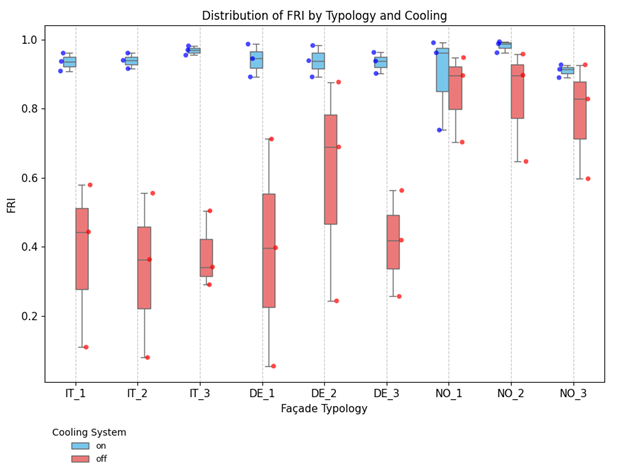
Figure 5. Distribution of FRI by Typology and Cooling. Source: own
Calibration Case: San Giorgio Library
The calibration case is a historic library in Bologna, Italy (San Giorgio in Poggiale), selected as a high-risk overheating reference within the broader façade resilience analysis. The building is characterized by a large single-volume space (~20 m in height), very high thermal mass masonry walls (up to 90 cm thick), single glazing, and limited natural ventilation, leading to pronounced heat accumulation and delayed thermal release during summer periods.
Importantly, the envelope characteristics of the library are consistent with Façade Typology 1 in the Bologna context, representing a high thermal mass, pre-retrofit construction, which, in the typological analysis, exhibited early degradation of passive resilience under Mediterranean climates. This alignment allows the calibration exercise to directly test whether the simulation workflow used for Typology 1 produces physically realistic thermal behaviour when applied to a real building.
The calibration relies on hourly measured indoor operative temperature data collected and published by Posani et al. (2019), including documented summer heatwave periods, enabling direct verification of the DesignBuilder model’s ability to reproduce real overheating dynamics and supporting the credibility of simulation-derived FRI values.
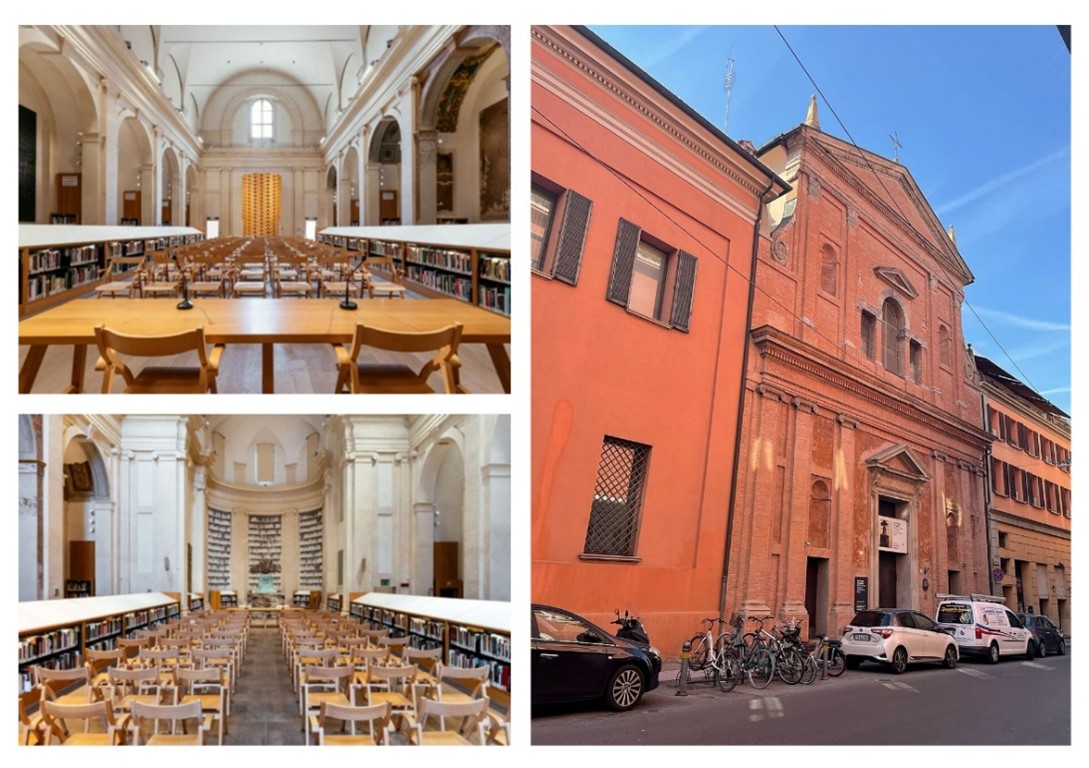
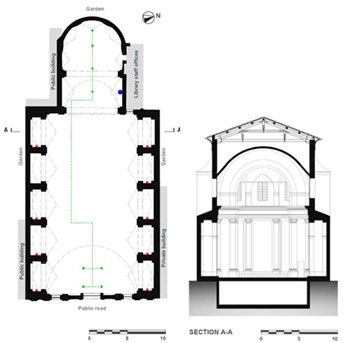
Figure 6. Calibration case study pictures with plan and section. Source: Posani et al. (2019).
DesignBuilder model setup and zoning strategy
The building was modelled in DesignBuilder v6.0, which uses the EnergyPlus v8.9 engine. Particular attention was given to reproducing vertical thermal stratification, which is critical for both occupant comfort and overheating dynamics in tall spaces.
Instead of modelling the main hall as a single zone, the space was subdivided into four vertically stacked thermal zones:
- Zone 1: occupied layer (0–2 m),
- Zone 2: lower conditioned volume (2–7 m),
- Zone 3: upper conditioned volume influenced by the main AHU,
- Zone 4: unconditioned attic.
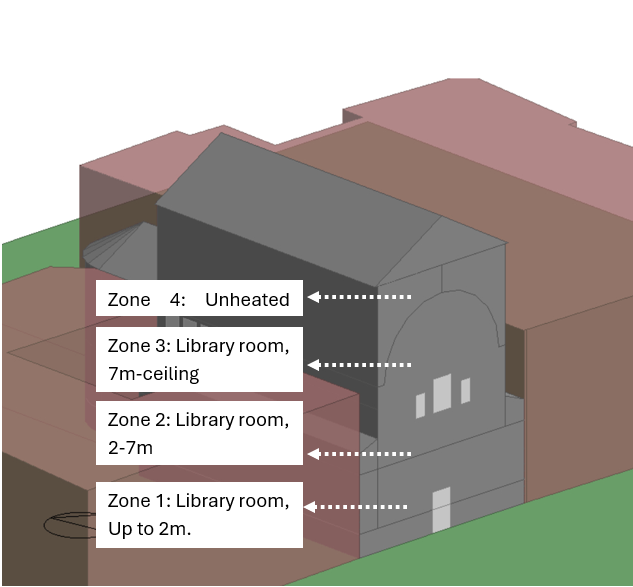
Figure 7. Representation of the zones defined for the model. The main room of the library is divided into three zones. Source: own
Interzonal separation was implemented using fictitious internal surfaces with negligible thermal resistance (0.5 cm thickness, λ = 50 W·m⁻¹·K⁻¹), allowing rapid heat exchange while preserving physically driven temperature gradients. This approach enabled DesignBuilder to capture stratification effects without introducing artificial insulation barriers between zones.
Envelope constructions were defined according to documented construction build-up, with massive masonry walls, timber roof structures, and single-glazed windows (U ≈ 3.2 W·m⁻²·K⁻¹). No tuning of material properties was performed beyond documented values, ensuring that calibration focused on thermal dynamics rather than parameter fitting.
HVAC representation and operational assumptions
The HVAC system was modelled based on documented system layouts, including:
- multiple AHUs supplying air at mid-height (~4 m),
- a central AHU is located at approximately 7 m height,
- a dedicated air recirculation and exhaust system operating mainly at ceiling level.
Cooling operation was implemented using capacity-limited control, rather than ideal load control, to avoid unrealistic setpoint clamping during heatwaves. Supply air temperature and humidity were constrained to realistic minimum values, and system availability was defined explicitly through seasonal schedules (June, July, and August).
Windows were assumed to be permanently closed, and outdoor air exchange occurred exclusively through infiltration, consistent with monitored conditions. Internal gains and occupancy schedules were disabled during calibration due to the lack of time-resolved data, which prevented compensatory tuning effects and maintained a conservative modelling stance.
Weather data and Calibration Periods
Calibration used a custom 2019 EPW weather file derived from hourly historical observations to ensure temporal alignment with measured indoor data. Model validation was conducted over three nested periods: the full summer (June–August 2019), a 7-day extreme heatwave, and a 3-day peak event, identified from daily-mean indoor operative temperature. These periods capture baseline, sustained, and peak thermal stress conditions relevant to overheating and resilience assessment (IOD, Tmax, recovery).
Calibration performance and implications for FRI validity
Statistical indicators confirm calibration quality, with CVRMSE below 6%, RMSE in the range of 1.1–1.3 °C, and R² exceeding 0.90. Although ASHRAE Guideline 14 is primarily defined for energy-based calibration, these statistical indicators are consistent with the performance ranges suggested by ASHRAE Guideline 14 and indicate a robust agreement between measured indoor air temperature and simulated indoor operative temperature throughout the season.
It should be noted that the measured data correspond to indoor air temperature, while the operative temperature is obtained from simulations. Given the high thermal mass of the monitored space, air and operative temperatures exhibit comparable peak levels and trends at the time scale relevant for extreme heat events.
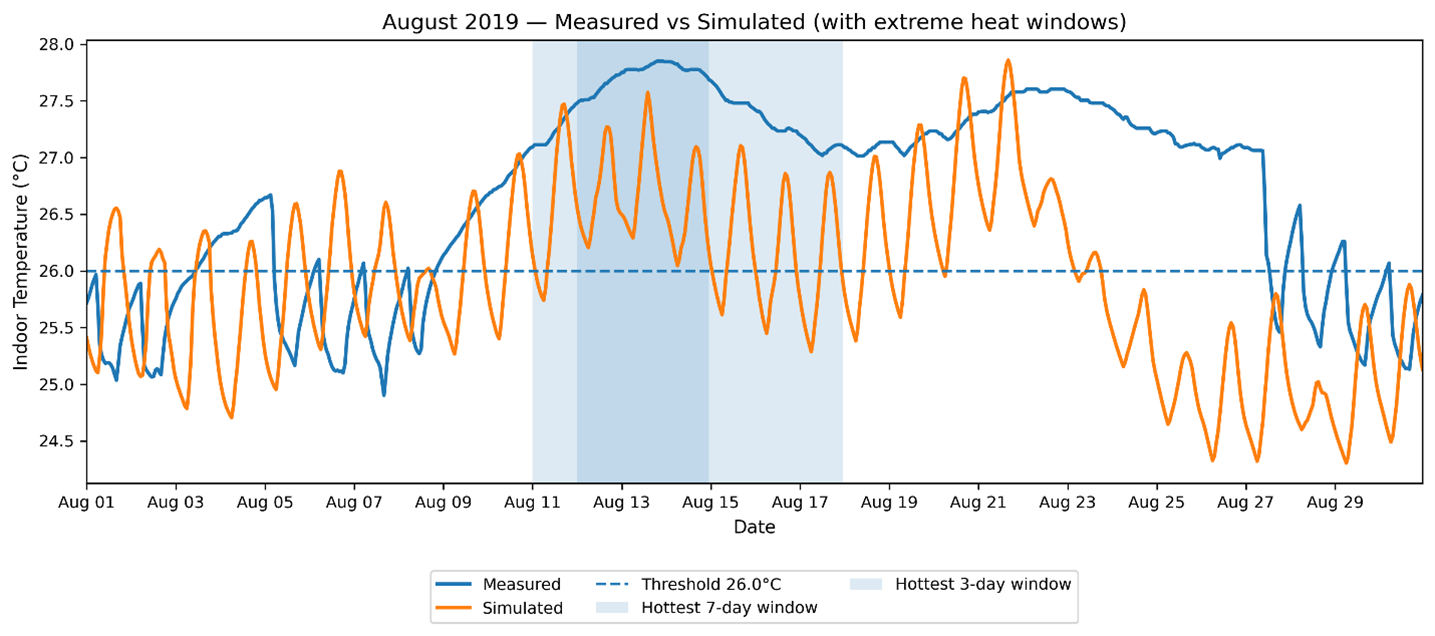
Figure 8. Measured indoor air temperature versus simulated indoor operative temperature in August 2019, with the 26 °C threshold and highlighted 7-day and 3-day extreme heat periods.
Model behaviour was further evaluated under extreme conditions by isolating the most severe 7-day heatwave and a nested 3-day peak event. During these periods, peak indoor temperature levels were reproduced with deviations below 0.3 °C, and post-event cooling rates were accurately captured. This demonstrates that the model represents not only average summer conditions but also peak thermal stress and recovery dynamics, which directly govern resilience indicators such as IOD, Tmax, and recovery time.
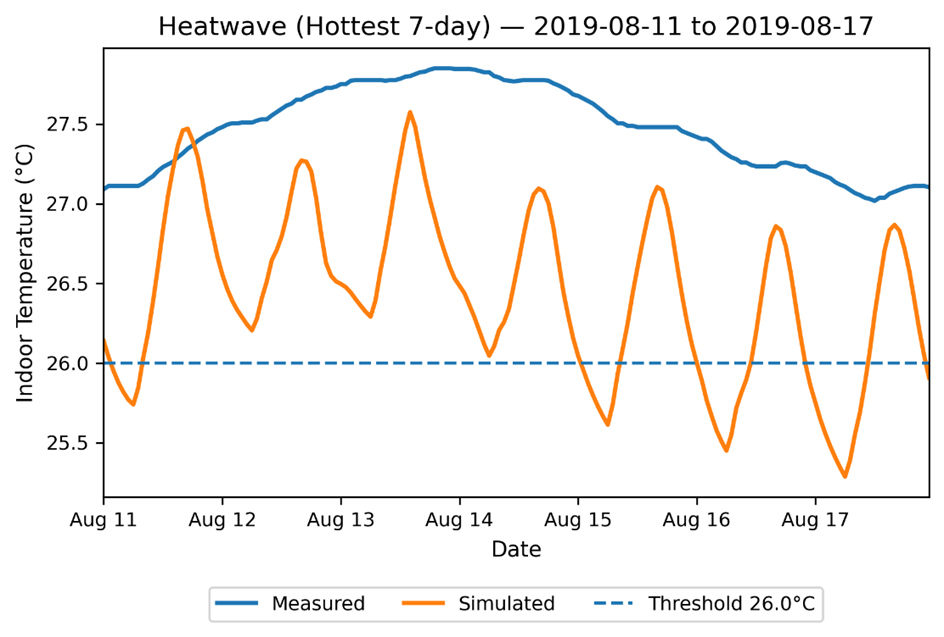
Figure 9. The model performance during the automatically detected 7-day extreme heatwave, confirming stable behaviour under sustained thermal stress. Source: own
Overall, calibration accuracy remained consistent during extreme events, with no increase in error dispersion relative to average conditions. This confirms that the DesignBuilder simulation workflow captures the physical mechanisms underlying façade-driven overheating and provides a robust and physically grounded basis for computing FRI values in simulation-only projects.
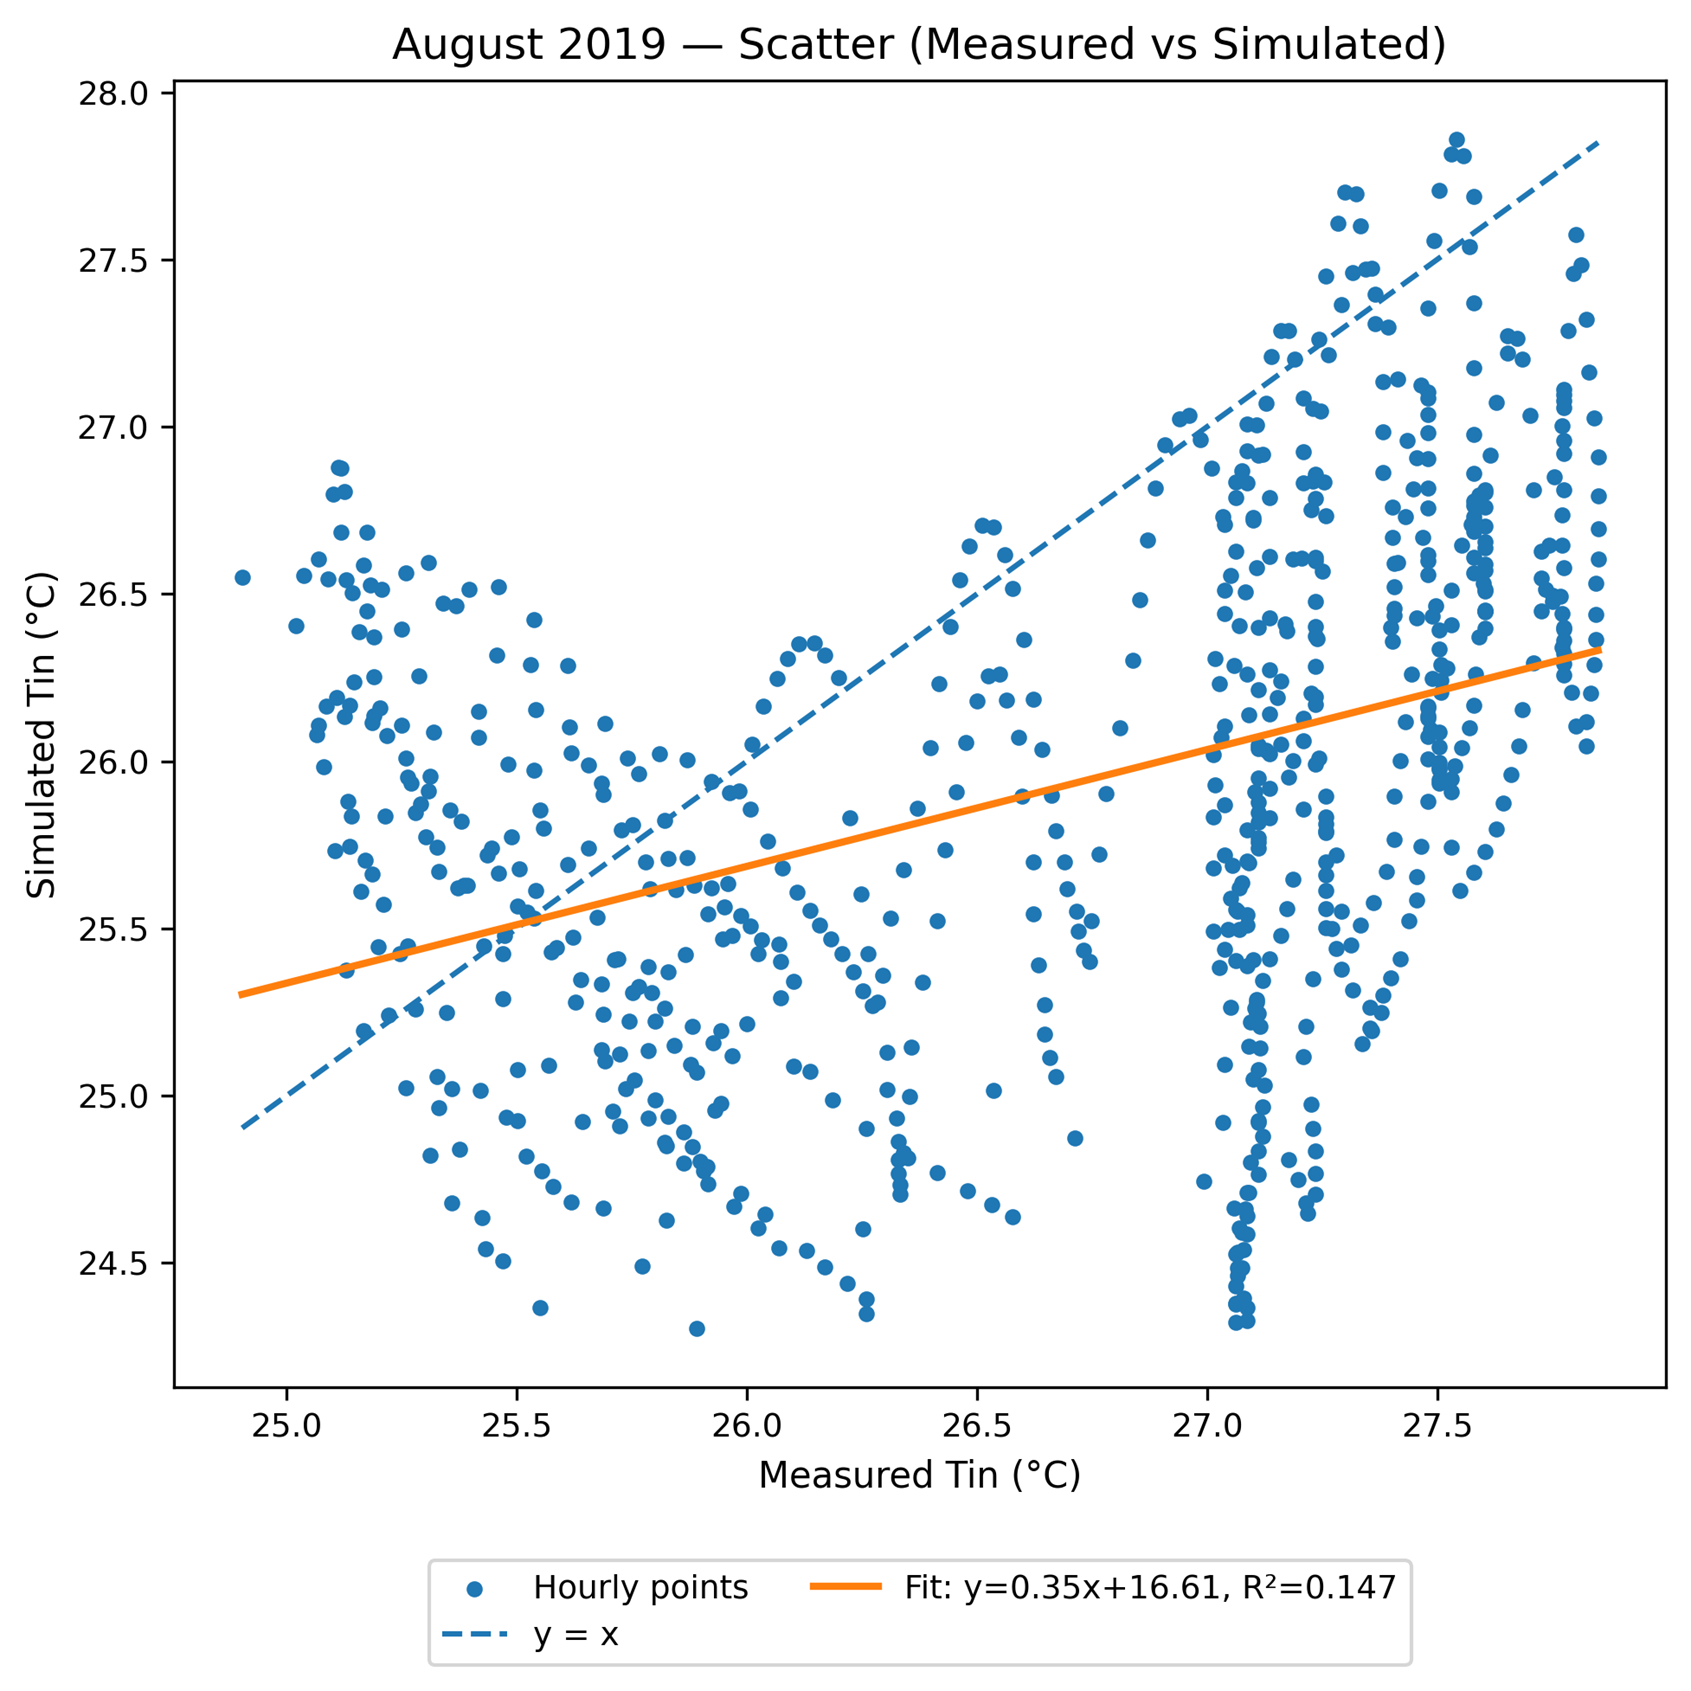
Figure 10. Bias Structure and Error Magnitude across Time Scales. Source: own
Appendix - Quantifying Thermal Resilience
This appendix explains how FRI and the six related indicators are calculated.
To address thermal resilience, three stages of resilience are introduced below. Resistance, Robustness, and Recovery - represented by six measurable indicators:
Resistance
- Thermal Autonomy (TA): % hours below 26 °C without cooling
- Indoor Overheating Degree (IOD): ∑(T – 26 °C) in °C·h
- Cooling Load (CL): annual cooling demand (kWh)
Robustness
- Time Above Threshold (TV): % hours above 26 °C
- Maximum Indoor Temperature (Tmax): °C
Recovery
- Recovery Time (Rt): hours required for indoor temperature to fall below 26 °C after the heat event
The 26 °C threshold follows EN 16798-1 and ASHRAE 55. To enable cross-typology comparison, all indicators are normalized to a 0–1 range using directional min–max normalization across the full dataset (3 climates × 3 typologies × 3 years × 2 operation modes, N = 54).
Because indicators have different desirable directions, Thermal Autonomy (TA) is treated as a positive indicator, while IOD, CL, TV, Tmax, and Recovery Time (Rt) are treated as negative indicators. This approach ensures that 1 represents the best and 0 the worst thermal resilience performance, while maintaining comparability between Cooling-ON and Cooling-OFF conditions.
Multi-Level Weight Optimization
Thermal resilience mechanisms differ sharply between passive (Cooling-OFF) and mechanically conditioned (Cooling-ON) modes. Therefore, indicator and phase weights were optimized separately for each mode.
Step 1 — Indicator-level optimization
Resistance and Robustness indicators were weighted using a full grid-search under constraints:
- Cooling-OFF: α+β=1 (TA, IOD)
- Cooling-ON: β+γ=1 (IOD, CL)
- Robustness splitter: 0.10≤δ≤0.90
- Lower bound 0.05 per indicator to avoid degeneracy
The objective function maximized the sum of directionally consistent Spearman correlations between FRI and its indicators.
Optimization was performed globally and repeated for each country; final weights are the median across countries.
Step 2 — phase level optimization
Resistance, Robustness, and Recovery were combined into:
FRI = W_RES · RES + W_ROB · ROB + W_REC · REC
Subject to:
W_RES + W_ROB + W_REC = 1
W_i ≥0.05
Grid-search (step 0.01) identified weights maximizing directionally consistent correlations.
Final optimized weights
- Cooling-ON:
- Indicator level → β(IOD)=0.585, γ(CL)=0.415, δ=0.195
- Phase level → RES=0.10, ROB=0.24, REC=0.66
- Cooling-OFF:
- Indicator level → α(TA)=0.05, β(IOD)=0.95, δ=0.455
- Phase level → RES=0.56, ROB=0.25, REC=0.19
These reflect physical mechanisms: passive resilience dominated by overheating accumulation (IOD), and active resilience dominated by recovery dynamics.
FRI Calculation
After normalization and weighting:
Resistance
- Cooling-OFF:
RES = α · TA + β · (1 - IOD)
- Cooling-ON:
RES = β · (1 - IOD) + γ · (1 - CL)
Robustness
ROB = δ · (1 - TV) + (1 - δ) · (1 - Tmax)
Recovery
REC = (1 - tR_norm)
Finally:
FRI∈[0.1]
 |
About the authorZahra Jahed Bozorgan, Architect & Building Science Researcher Graduated with a Master’s degree in Building Engineering-Architecture from the University of Bologna. I am passionate about energy modelling and building performance simulation, with a strong interest in designing energy-efficient and climate-responsive buildings. |