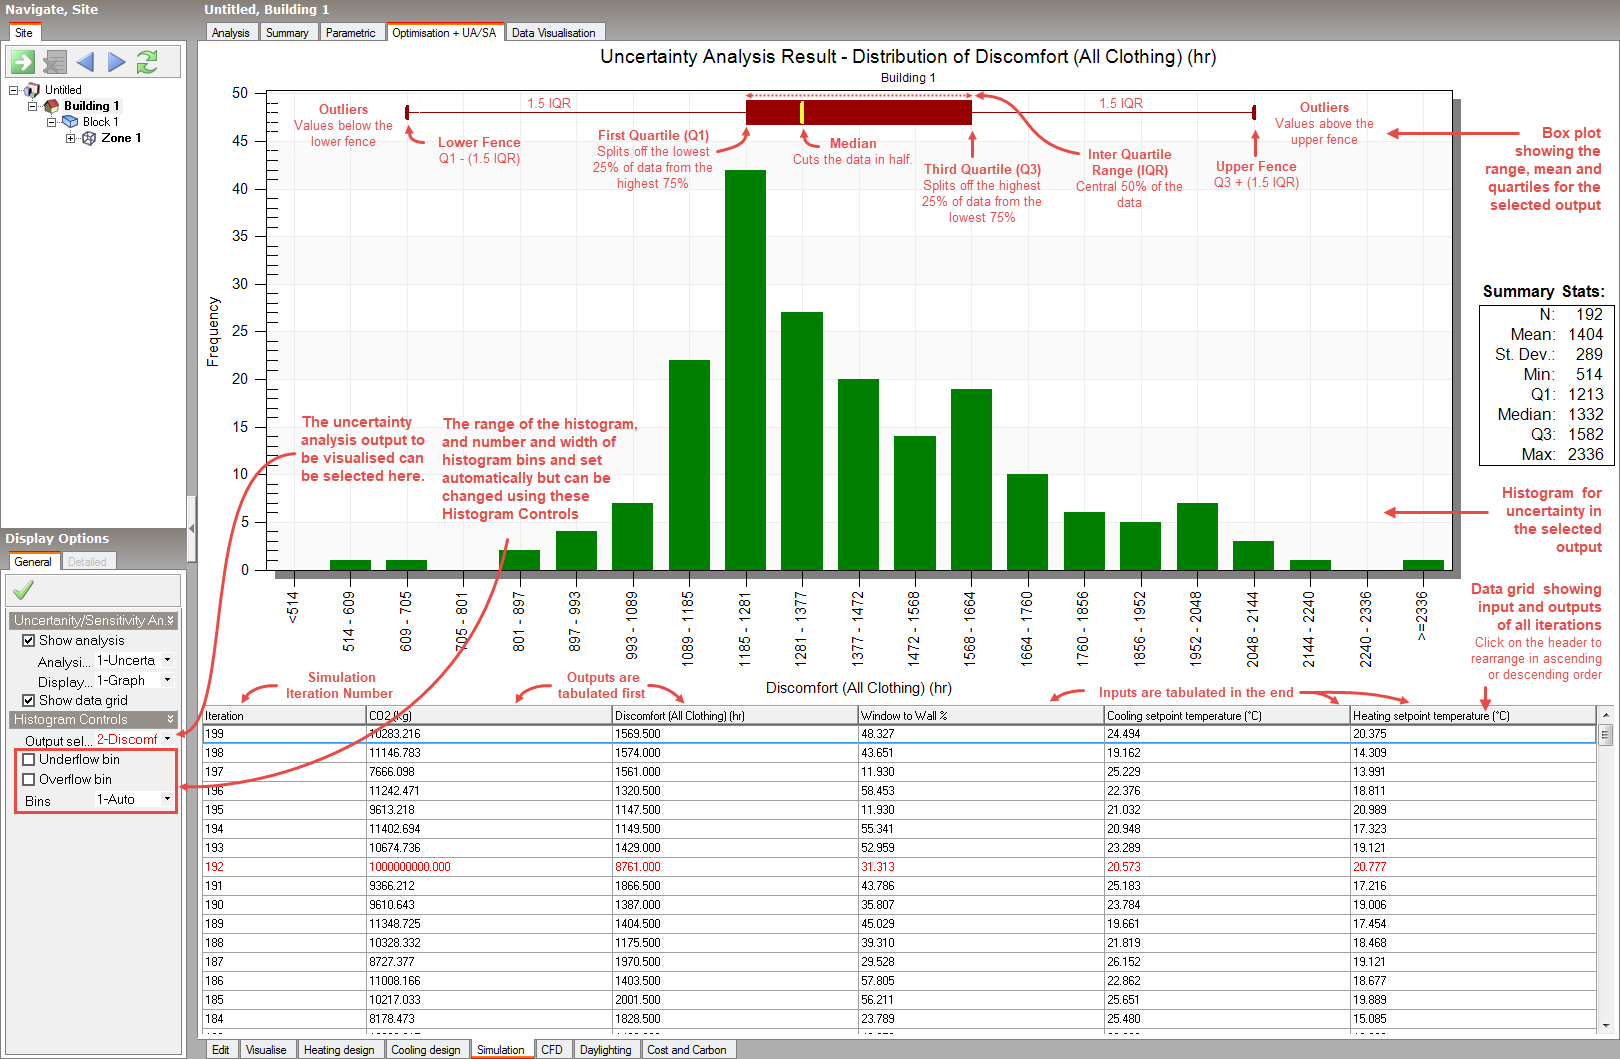
After finishing the uncertainty and sensitivity analysis, uncertainty analysis results can be accessed from Simulation screen by setting the Analysis type to 1-Uncertainty Analysis and the Display type to 1-Graph. The screenshot below shows the main features of the uncertainty analysis graph.
Note: Depending on the number of variations being simulation you may notice that some duplicate cases are reported. This is because uncertainty is based on probability of design permutations happening, so it is necessary to count all the repeated instances to obtain the correct probability of a particular output. If we were to remove all the duplicates then once the entire search space is simulated the results would be more evenly spread out, which would be incorrect. For more "efficient" sampling you should consider using the LHS option to ensure that samples are more equally distributed.
When the Display type is set to 1-Graph the Histogram plot can be controlled by making settings under the Histogram Controls header on the Display Options panel.
The option selected here determines which output is plotted in the histogram. The list contains all available Outputs that were requested as a part of the uncertainty analysis run.
Select this checkbox to create a bin for all values below or equal to the value in the box to the right.
Value
To change the value, enter a different decimal number in the box. It must be more than the overflow value.
Select this checkbox to create a bin for all values above the value in the box to the right.
Value
To change the value, enter a different decimal number in the box. It must be less than the underflow value.
The histogram can be created based on following configuration for the bins:
Note: Sometimes the number of bins is more than what can be displayed on the screen properly and in such cases a horizontal scroll bar is added to the bottom of the graph to allow all of the data to be seen.
After finishing the uncertainty and sensitivity analysis, a report detailing the results of the uncertainty analysis can be viewed on the screen by setting Analysis to 1-Uncertainty Analysis and Display Type to 2-Report.
The uncertainty analysis report consists of following sections:
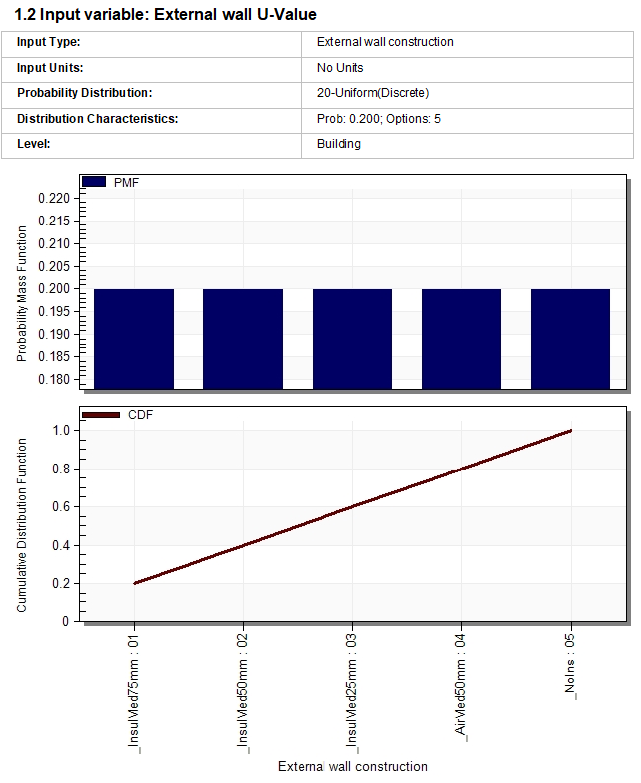
The Input variables report lists the name, units, probability distribution type and options used in the UA and the level at which the variable was applied (e.g. "Building"). The screenshot below shows as example graphic for 1 variable in the analysis.
Outputs (KPIs): Details of the outputs analysed.
Analysis Information: Analysis summary, details about the input samples.
Uncertainty Analysis Results: Graphs and statistical details showing the variability in the output.