Climate Analytics Data
Accessed by selecting the Climate Analytics Data radio button in the top left of the map.
This is the main option which allows you to download Climate Analytics Design and Actual year weather data from any of the 43,000 weather stations across the world. Each of these stations is categorised by colour according to the amount and quality of data available.
Quality Categories
The legend describes the meaning of each colour (category) and allows stations in each category to be displayed on the map or not.
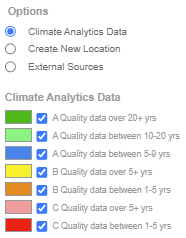
The colour of each icon indicates the quality of the data as follows:
-
Dark Green icons indicate the stations with the most high quality measured data available (over 20 years with more than 90% of measured data available).
-
Light Green icons indicate the stations with (10 - 20 years with more than 90% of measured data available).
-
Blue icons indicate the stations with (5 - 9 years with more than 90% of measured data available).
-
Yellow icons indicate the stations with (> 5 years with 80-90% of measured data available).
-
Orange icons indicate the stations with (1 - 5 years with 80-90% of measured data available).
-
Pink icons indicate the stations with (> 5 years with < 80% of measured data available).
-
Red icons indicate the stations with least high-quality measured data available (1 - 5 years with < 80% of measured data available).
For each quality category in the legend you can choose to show or hide the corresponding icons on the map. For example to only show the stations with over 20 years with more than 90% of measured data available you can uncheck all of the checkboxes apart from the dark green one at the top.
Accessing the Data
To access the data for a particular station:
-
Navigate to the appropriate station using the mouse and/or the zoom control in the top left of the screen. See the Navigation section for details.
-
Move mouse over coloured station icons to display a popup data panel such as the one shown in the screen below. The panel summarises the statistics for the station:
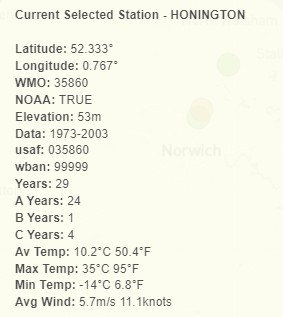
The statistics in this summary data panel are described in detail on the help page for the Station tab of the Station dialog.
-
Select the station by clicking on its coloured icon. This opens the Station dialog which provides access to a range of analysis tools and download options.
-
Use the Analysis tab to view yearly, monthly or daily climate data for the location for years between 1970 and the previous year. This may help you to select a particular year of data according to the needs of your project.
-
Use the Download tab to download design or operational data for years between 1980 and the current year with a range of different options.
-
Once you have finished your session for the station press the “Close” button to close the Station dialog and return to the map.